


In this blog we are going to learn about how to debug lightning framework in chrome browser more efficiently.
We are going to perform this task by using Salesforce Lightning Inspector Chrome Extension. It is Google Chrome DevTools extension that enable you debug the component and inspect the component markup. Let’s see how to use it.
Installation And Navigation
Installation :
First of all, download and install the Salesforce Lightning Extension from here.
Navigation :
- After adding this extension to your chrome browser open developer console, you will see the Lightning tab as shown below.
 Note: If page is not containing any lightning framework such as lightning component or lightning application, on clicking this tab this will show error message like : Lightning was not detected on this page.
 - After clicking lightning tab you will see the following subtab:
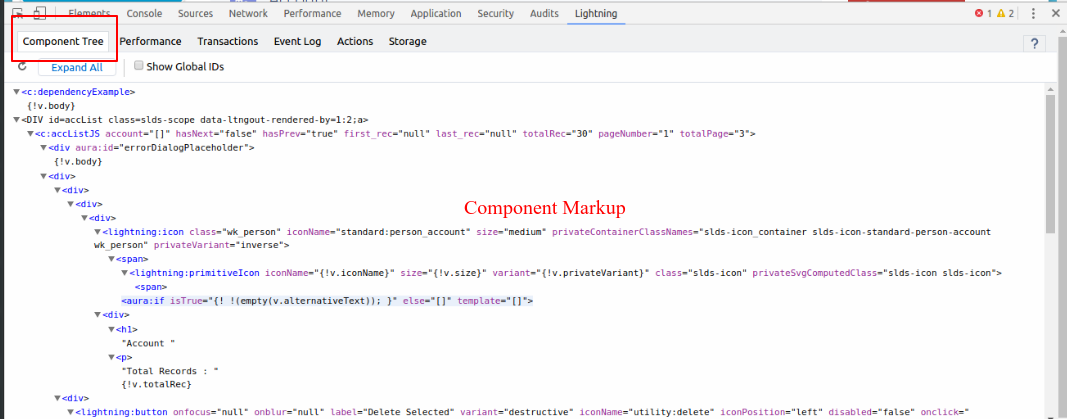
- Component Tree
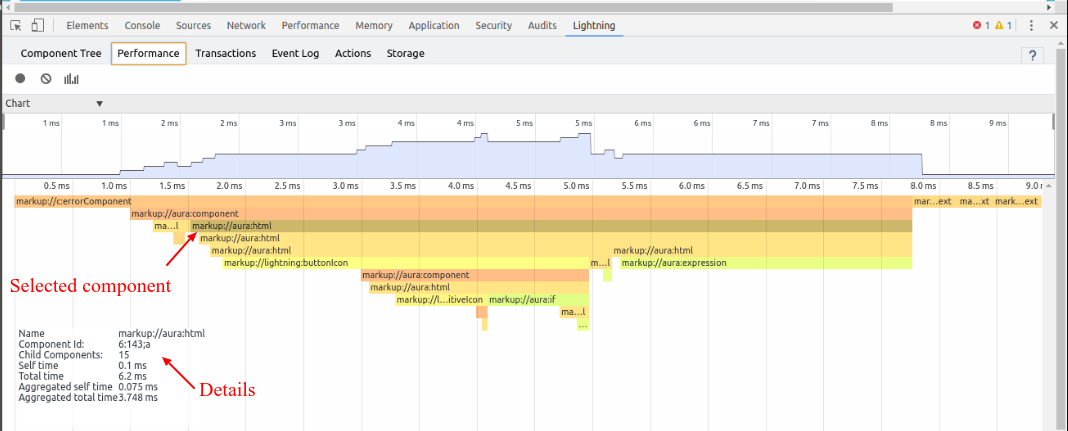
- Performance
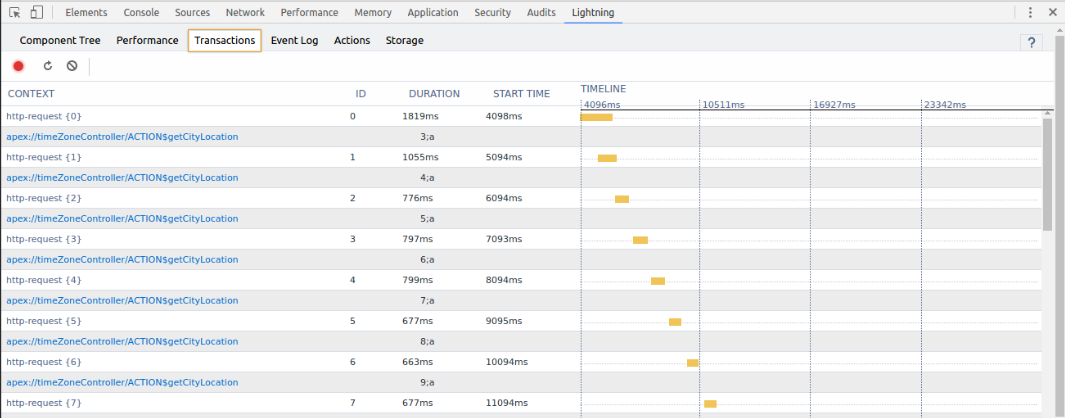
- Transaction
- Event Log
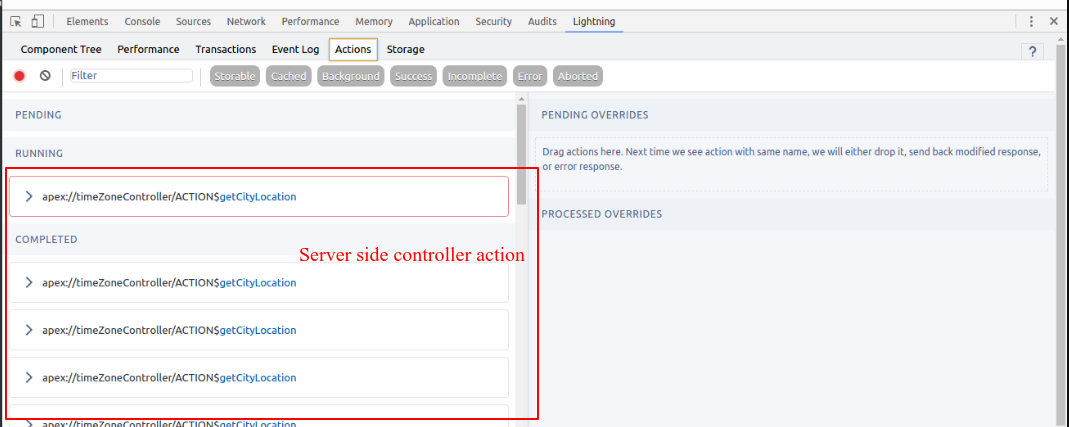
- Actions
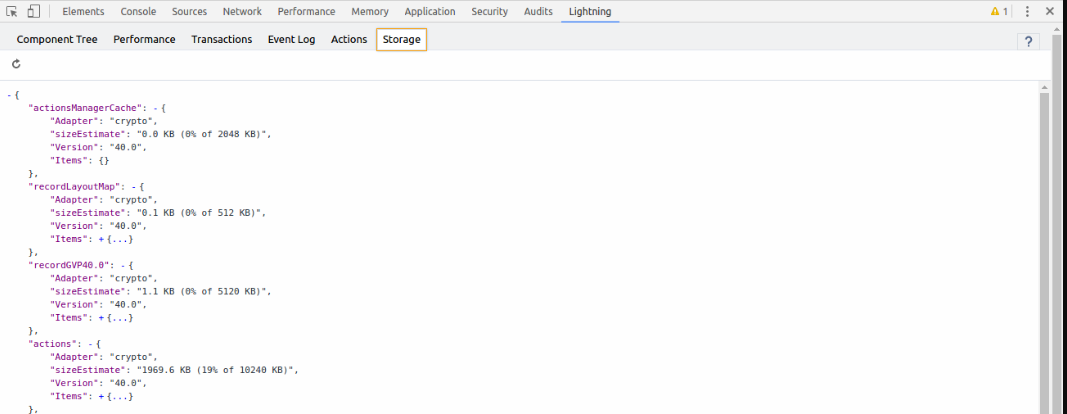
- Storage
- Component Tree : Shows component markup in nested tree format
- Performance : Shows graph of the creation time for your components.
- Transaction : Some apps delivered by Salesforce include transaction markers that enable you to see fine-grained metrics for actions within those transactions. You can’t create your own transactions.
- Event Log: Shows all event fired. It help you to manage sequence of your event.
- Actions: Shows sever side action executed.
- Storage : This tab shows storage in salesforce1 and lightning experience.
For more information please visit
Salesforce Documentation
SUPPORT
That’s all about how to debug lightning framework in chrome browser more efficiently, still if you have any further query or seek assistance to make your salesforce classic apps compatible with lightning experience, feel free to contact us, we will be happy to help you
https://wedgecommerce.com/contact-us/